Introducing Dashbored: Generate static dashboards using Gatsby
By Willoo Koko - 5 September 2025
3 Min Read
Based on Gatsby, Dashbored works to fill the void for simple, free and open-source dashboards. The goal is not to rival big names like Periscope but provide an alternative for smaller outfits that don’t require the full power of those products (or the accompanying price tags).
And the creation of these dashboards and data visualisations need not be limited to developers. Indeed, our Product Managers and Account Managers should be able to contribute with simple SQL queries (once their contributions have passed our Code Review process, that is). 😉
How and why we are using Gatsby
Our first iteration was using Nextjs, but we soon realised we didn’t need the complexity of a real-time interface. Because, most of the time, a dashboard showing the data from yesterday gives you most of the valuable information you are looking for from a dashboard. The other problem we faced was how to deliver a dashboard built on top of Next.js to everyone, given Next.js has no easy, extensible system for building packages on top of it.
I’d been aware of Gatsby for a but never had the chance to use it, and once we’d realised our dashboard could be static, Gatsby seemed like the perfect choice. However, pretty early on, we faced the same issue as Nextjs: a Gatsby plugin wasn’t enough to provide the kind of functionality we wanted for our project. That was when the Spectrum community of Gatsby sent me this article.

Voila! Gatsby themes were exactly what we were looking for and provided us with the right tool for our project.
This article isn’t about Gatsby themes, which you should definitely check out, but rather how to extend Gatsby to a pre-designed/themed website based on Gatsby, allowing the user to access the power of Gatsby.
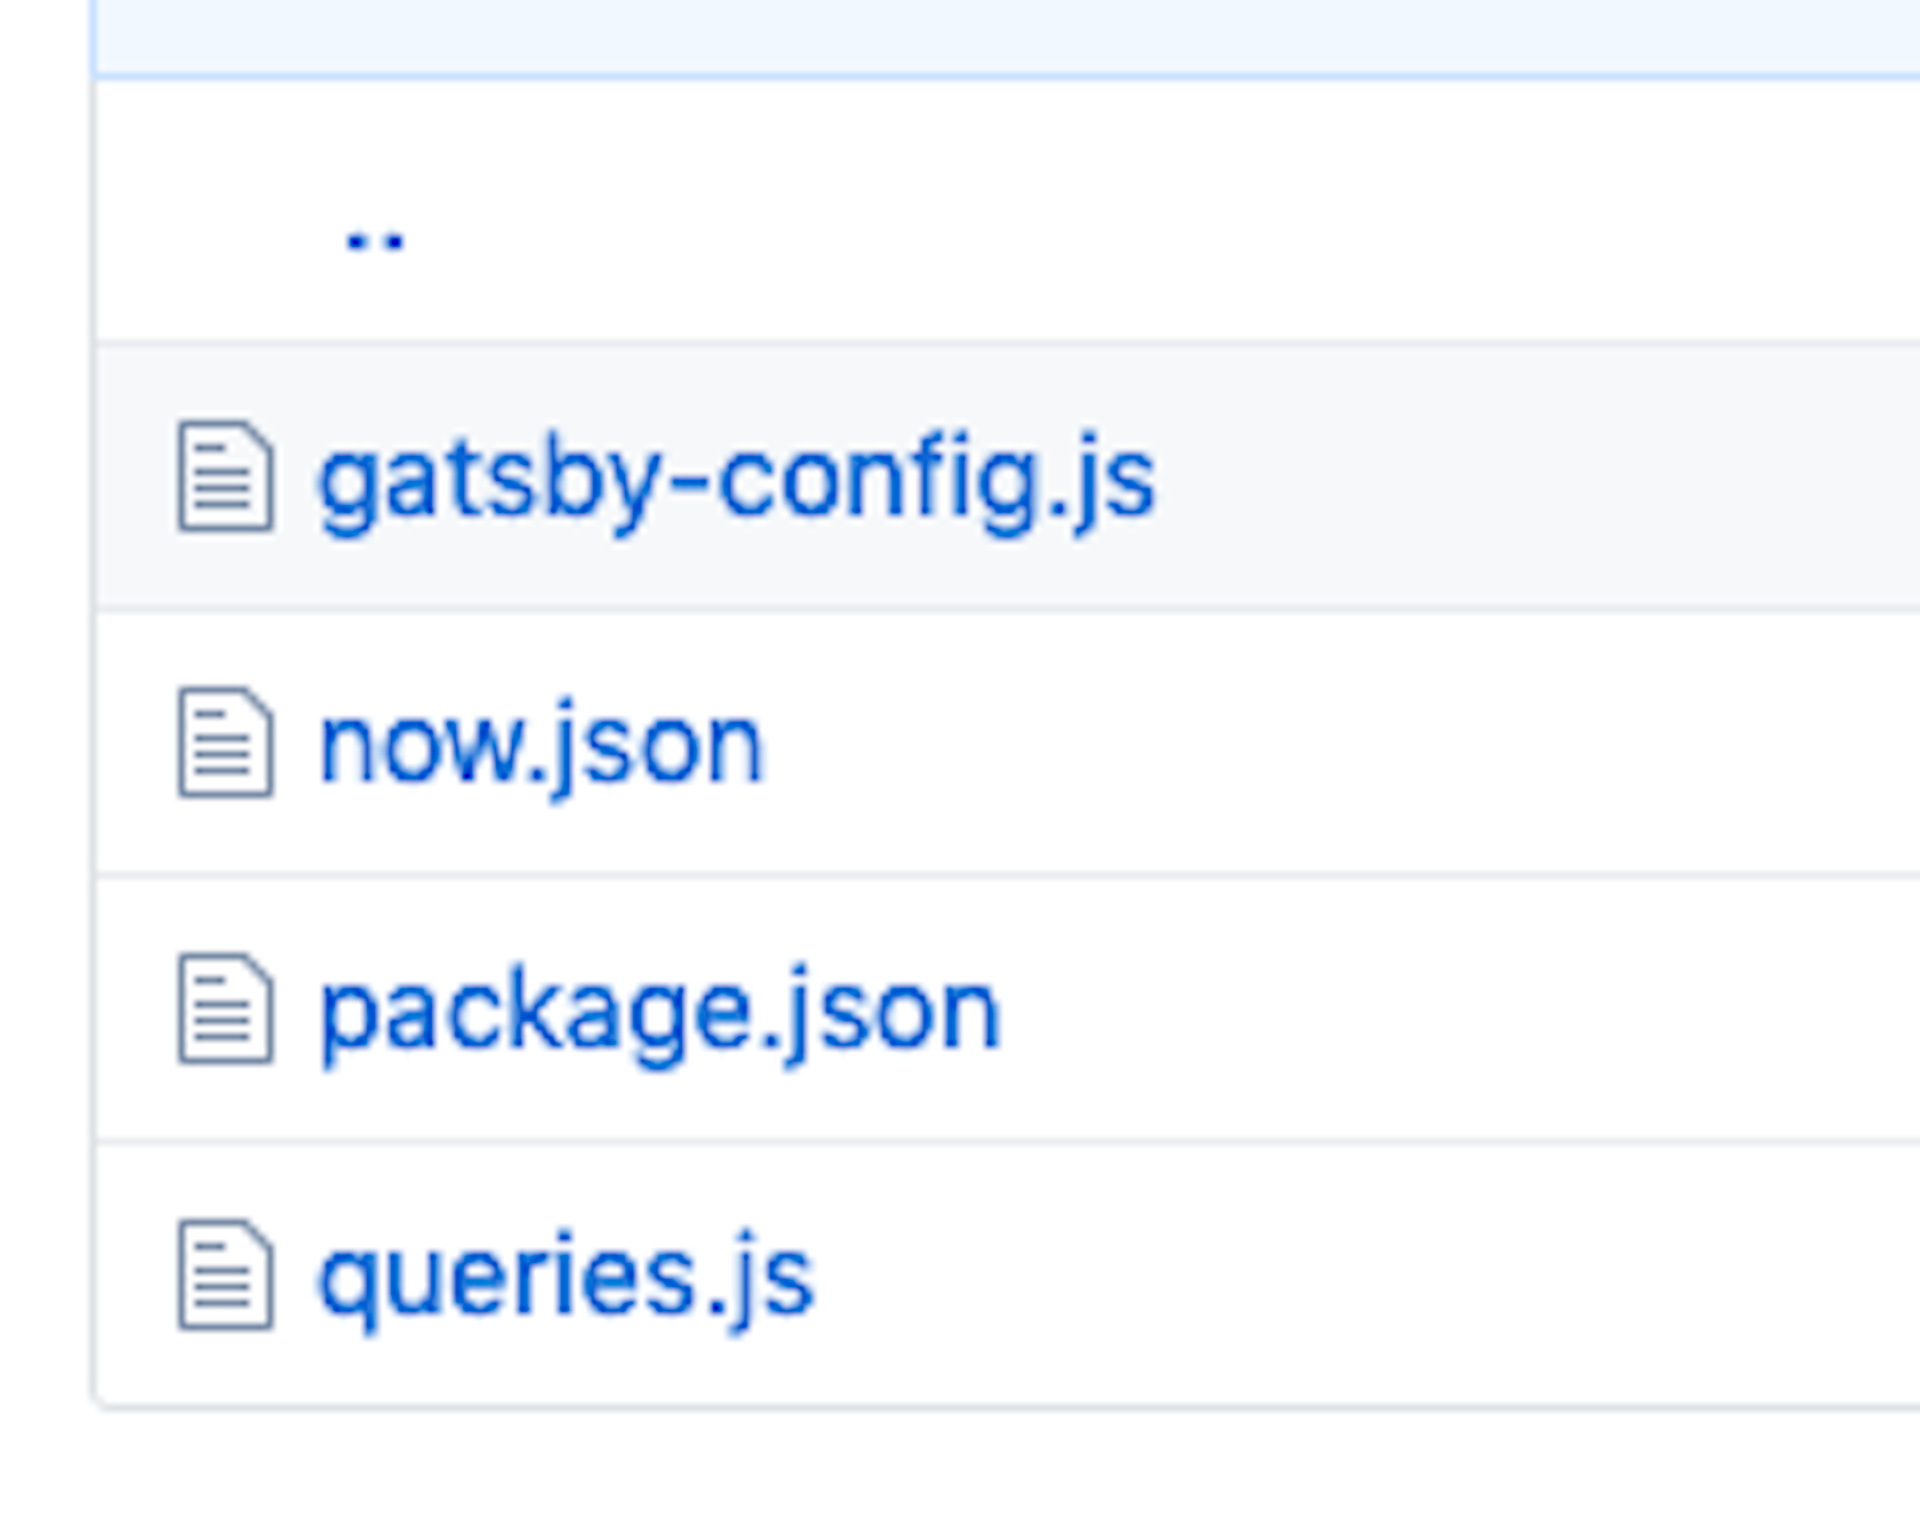
Thanks to Gatsby themes, your Dashbored repository will look like this:

Your gatsby-config.js will look like this:
![module.exports = { siteMetadata: { title: 'The Forgotten Knowledge' author: 'Planes', description: 'A Dashboard of knowledge' }, __experimentalThemes [ { resolve: 'gatsby-theme-dashbored', options: { queryfile: './queries.js' } } ] }](https://www.datocms-assets.com/60253/1623872861-1-xsfnuct3vj7de3nomorha.png?auto=format&bg=transparent&fit=crop&fm=png&q=100&w=1920)
Pretty simple right? Most of the ‘complexity’ will be in your queryfile. This is where you are going to define your pages and the widgets for each of them. A pretty simple example could look like this:
![module.exports = [ { title: 'Unicorns', default: true, queries: [ { name: 'Number of unicorns', type: 'number', query: () = [{ value: 42 }], }, { name: 'species of unicorn' type: 'pie', query: () = [ { id: gingercorn', label: 'Gingercorn', value: 1 }, { id: blondecorn', label: 'Blondecorn', value: 1 }, { id: invisiblecorn', label: 'Invisiblecorn', value: 1 }, { id: 'flycorn', label: 'Popcorn', value: 1 }, { id: 'popcorn', label: 'Popcorn', value: 1 }, ], }, { name: 'Number of unicorns in the world', type: 'number', column: 2, query: () = [{ value: 42 }], }, ], }, ]](https://www.datocms-assets.com/60253/1623872912-1-idhxpb-pjdgqtknriv-dug.png?auto=format&bg=transparent&fit=crop&fm=png&q=100&w=1920)
First, your queryfile will export an array of objects, and each object will represent a page in your dashboard. Each page has multiple properties (title, queries, etc.).
Presently, you can create 5 kinds of widgets, number, pie, bar, line and scatter charts, all based on Nivo, and Dashbored lets you pass configuration to your Nivo widgets.
If you’d like to learn more about using Dashbored, check out the Getting Started Guide or the Demo.